Late
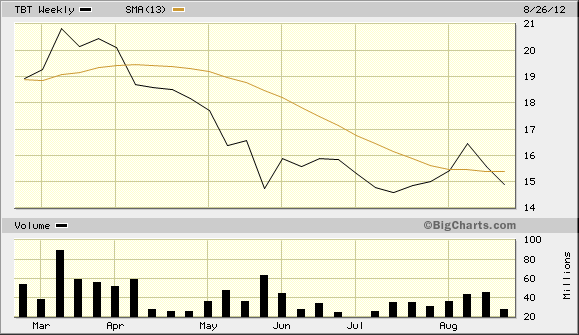
Thursday I dumped TBT, which is a bet the price of bonds will go down
and the yield will go up at the closing price of 15.31. It had crossed
over the moving average line to the downside. This has been the curse of
betting on the market for the last year, The dreaded whipsaw effect. We
get short term ups and downs that cross over the moving average lines
in both directions. We paid 15.50 a share when we placed our bet and
sold at 15.31 for a loss of 19 cents a share. The chart of TBT is below.
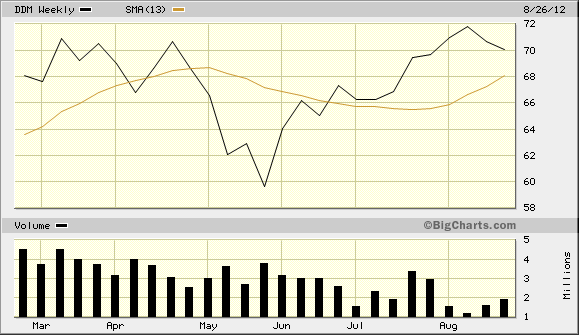
Our next chart is DDM which is a bet on a rising Dow. It is still above the moving average line. Nothing to report on this one other than wondering what is keeping it up as high as it is. DDM, like Oil and Gas may have made a top and is rolling over to the downside.
Our next bet is on the price of oil and gas. This is represented by DIG which is a proxy for the Oil and Gas industry. Chart below. Oil and Gas is looking a little toppy here.
Another bet in the model portfolio is GDX which is the Proxy for the Gold miners. GDX is still looking good. I'm hoping it will make it's rocket to the moon price move. Lord that's a beautiful looking chart.
Our final chart will be the Model Portfolio Tracker which is now minus TBT. The 3 ETF proxys left are up 8.18% so far and all 3 are in the black.
| Today | Since Purchased | ||||||||||
| Symbol/Name | Price* | Change | Last Trade |
Gain/Loss
(USD)
|
Shares | Price Paid |
Purchase Date |
Gain/Loss
(USD)
|
% Change | % Port | Value
(USD)
|
|
DDM:US ($) ProShares Ultra Dow30 |
70.05 | +0.93 | 08/31 |
+93.00
|
100 | 66.00 | 07/07/2012 |
+405.00
|
+6.14 | 42.74 |
7,005.00
|
|
DIG:US ($) ProShares Ultra Oil & Gas |
45.90 | +0.77 | 08/31 |
+77.00
|
100 | 41.00 | 07/07/2012 |
+490.00
|
+11.95 | 28.01 |
4,590.00
|
|
GDX:US ($) Market Vectors Gold Miners ETF |
47.94 | +1.92 | 08/31 |
+192.00
|
100 | 44.50 | 07/27/2012 |
+344.00
|
+7.73 | 29.25 |
4,794.00
|
| Totals |
+362.00
|
+1,239.00
|
+8.18 |
16,389.00
| |||||||


No comments:
Post a Comment